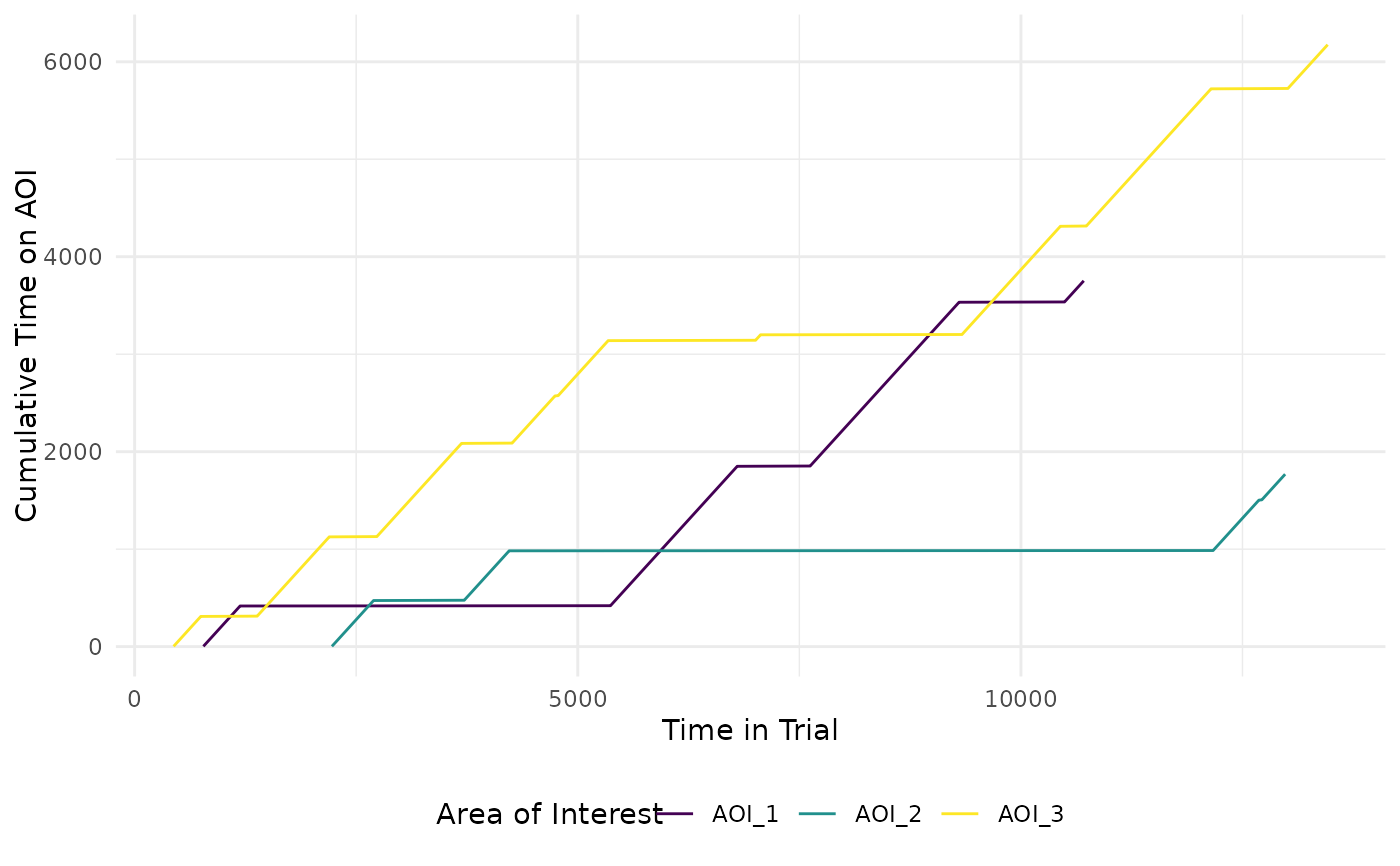
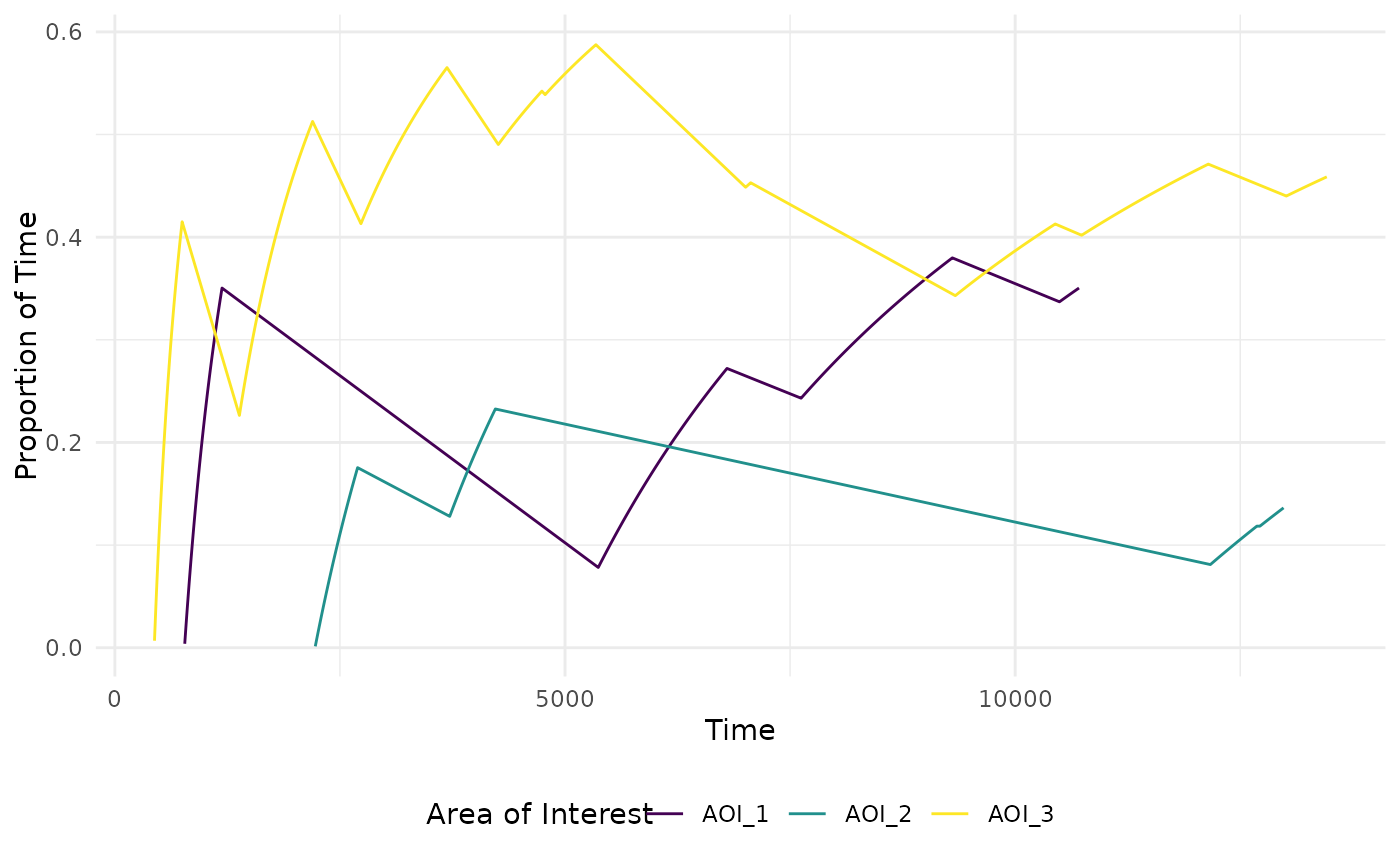
Plots absolute or proportional time spent in AOIs over time
Source:R/plot_AOI_growth.R
plot_AOI_growth.RdA visualisation tool for plotting the changes in defined AOI regions across a single trial time.
Usage
plot_AOI_growth(
  data = NULL,
  pID_values = NULL,
  trial_values = NULL,
  AOIs = NULL,
  type = "abs",
  plot_time_not_in_AOI = FALSE
)
Arguments
- data
raw data in standard raw data form (time, x, y, trial)
- pID_values
specify particular values within 'pID' to plot data from certain participants
- trial_values
can be used to select particular trials within the data
- AOIs
A dataframe of areas of interest (AOIs), with one row per AOI (name, x, y, width_radius, height)
- type
either "abs" (absolute) or "prop" (proportion)
- plot_time_not_in_AOI
boolean as to whether to include proportion of time spent outside AOIs
Examples
# \donttest{
data <- combine_eyes(HCL)
data <- interpolate(data)
# plot absolute and then proportional
plot_AOI_growth(data = data, AOIs = HCL_AOIs, type = "abs")
#> Multiple pIDs detected: randomly sampled - pID:118
#> Multiple trials detected: randomly sampled - trial:4
 plot_AOI_growth(data = data, AOIs = HCL_AOIs, type = "prop")
#> Multiple pIDs detected: randomly sampled - pID:118
#> Multiple trials detected: randomly sampled - trial:5
plot_AOI_growth(data = data, AOIs = HCL_AOIs, type = "prop")
#> Multiple pIDs detected: randomly sampled - pID:118
#> Multiple trials detected: randomly sampled - trial:5
 # }
# }